Please note that this is work in progress, and this page will be updated before end of February 2015
1. Introduction
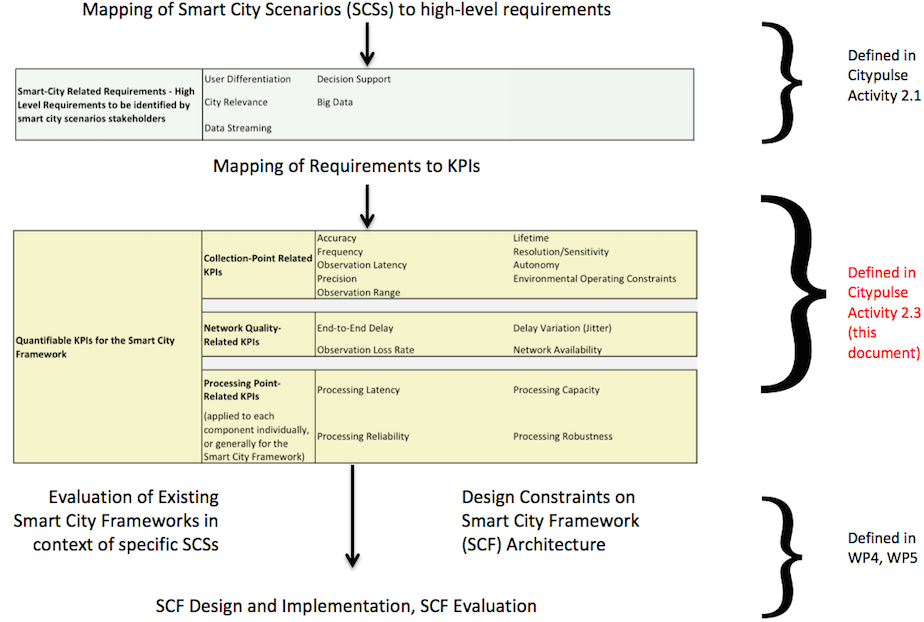
The vision of a Smart City, where services to improve everyday life are offered to citizens, is realized through a number of use cases or Smart City scenarios, incrementally contributing towards this vision. Smart City scenarios exhibit great variance in a number of areas. The CityPulse EU FP7 project 101 scenarios exemplify this variance. Number of users and data sources, spatio-temporal scenario coverage, security, network and data processing capabilities are few of the factors that vary across different scenarios. In order to be able to support Smart City scenarios, designers have to take under account the distinct requirements of every scenario when architecting the Smart City Framework (SCF), i.e. the hardware and software infrastructure to support the aforementioned scenarios. On the other hand, existing SCFs would require a set of quantifiable metrics for evaluation against the requirements of future Smart City scenarios. This page introduces a primer for evaluating SCF support for Smart City scenarios. Figure 1 below illustrates our approach.
The high-level requirements for a Smart City scenario were developed in Activity 2.1 of Citypulse (click here for report). The report established a number of functional and non-functional requirements of Smart City scenarios, that can affect planning and design of supporting infrastructure. The non-functional requirements are mostly about relevancy of the scenario to a municipality, individual citizen, cultural, regulatory/government level. They are scenario-specific and require qualitative analysis of context outside of the technical capabilities of a SCF. There are however functional requirements which can be mapped to measurable/formally definable metrics (Key Performance Indicators or KPIs).
The rest of this page describes the high-level requirements of a Smart City scenario, the measurable KPIs at an SCF level, and:
- How high-level scenario requirements can be mapped to KPIs for designing new SCFs to implement these scenarios.
- How the KPIs for measuring the performance of an SCF can be mapped to high-level requirements to evaluate applicability of current SCFs to smart city scenarios.
2. Presentation of high-level Smart City scenario requirements and SCF-quantifiable KPIs
2.1 Introduction
We begin with a description of the high level requirements for Smart City scenarios, and continue with a detailed description of the KPIs on a SCF level. The goal of this section is to offer a complete picture of what aspects should be considered when conceiving a Smart City Scenario and how it's requirements should be documented, as well as to offer a reference of the technical considerations (in the form of KPIs) that have to be taken under account when the scenario is being implemented. The next section discusses how the KPIs can be mapped to some of the high-level requirements.
- Smart City Scenario (application - related) KPIs
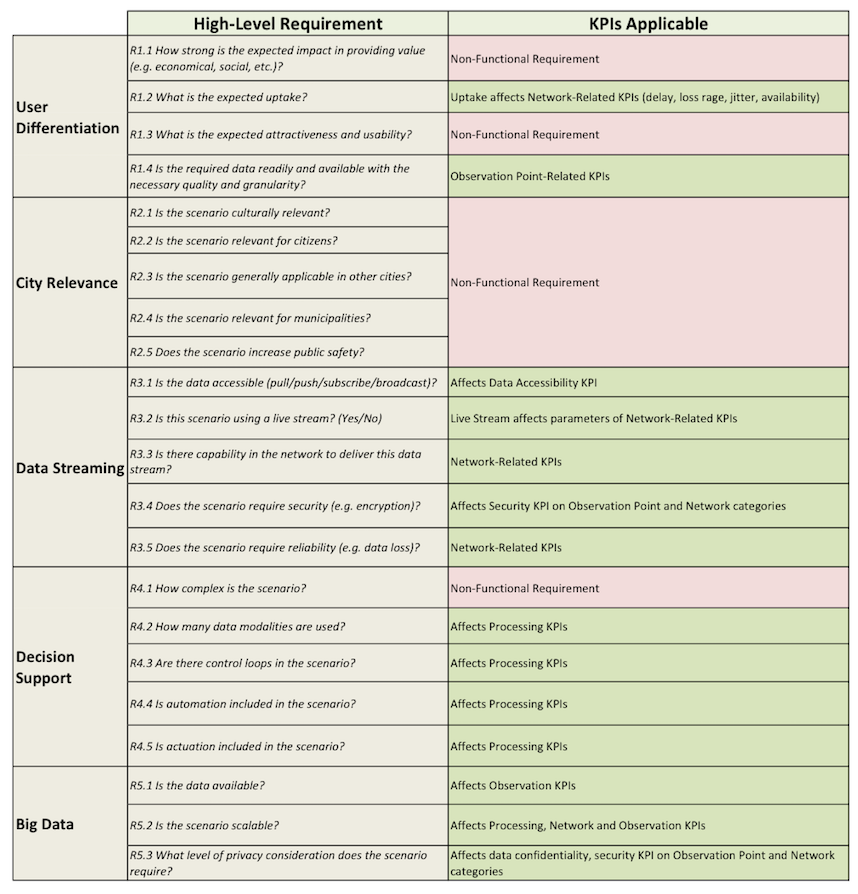
These are high-level KPIs in the form of requirements which were defined as part of Activity 2.1 in Citypulse. To download the report for this activity click here. The KPIs are illustrated in the figure below for convenience:
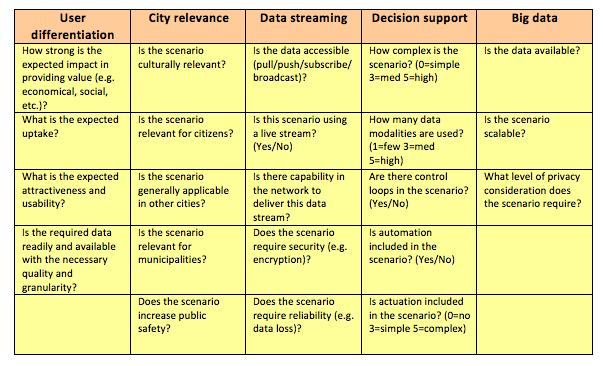
Figure 2: High-level Smart City scenario requirements. These requirements are rated at a qualitative level (1-5) per scenario.
- Smart City Framework - related (SCF) KPIs
The application-related KPIs presented above drive the design of a SCF, which is itself constrained from functional requirements, i.e. quantifiable, measurable KPIs. We use as primer the functional structure of a generic SCF as illustrated in figure 3, to define KPIs measuring different aspects (e.g. quality, efficiency, reliability, security etc.) of SCF performance upon collection of Smart City data, transmission of the collected data for processing and finally processing of this data.
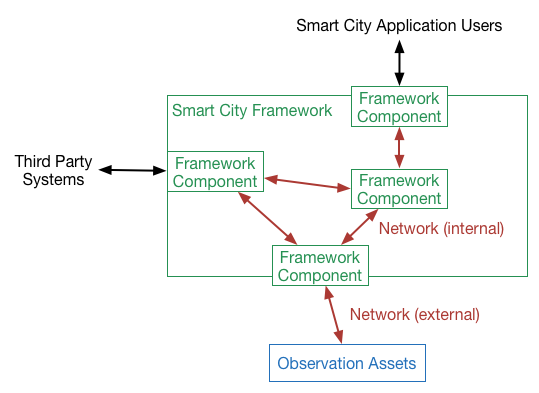
Figure 3: Functional view of a generic SCF, which drives categorisation of KPIs on a functional requirement level. Data is observed (measured) from and transmitted by observation assets to the SCF for further processing. KPIs that evaluate SCFs can be applied to every step of this process, i.e. on the observation assets that collect the data, on the network connection that transports this data from the observation assets to the SCF, as well as internally to the SCF where the data is being processed.
Based on the functional component these KPIs are measured in, we split them into three categories:
- Observation Point-Related KPIs: These are KPIs that relate to the function of observation points (as observation points we define assets such as virtual and physical sensors that report their observations of parameters of the virtual, physical environment to the SCF) as well as the environmental, temporal constraints these observation points operate in.
- Network Connection-Related KPIs: These are KPIs that relate to the quality of the network connection between the observation points and the SCF, but also internally to the SCF, between its components.
- Data Processing-Related KPIs: These are KPIs that relate to the computational capabilities of the SCF and can be applied to different levels of abstraction, i.e. to the SCF as a whole, or on individual components of the SCF. If applied to a component-level, these KPIs are further split into two subcategories, internal KPIs (which concern the performance of data processing inside a component), and external KPIs (which treat the components as "black boxes", only measuring different parameters of data input and output).
We describe the specific KPIs as well as ways they can be measured in the subsections below. Note that the measurement methods supplied are merely suggestions, and that KPIs can also be measured in other ways - consistent of course with the original definition of the respective KPI.
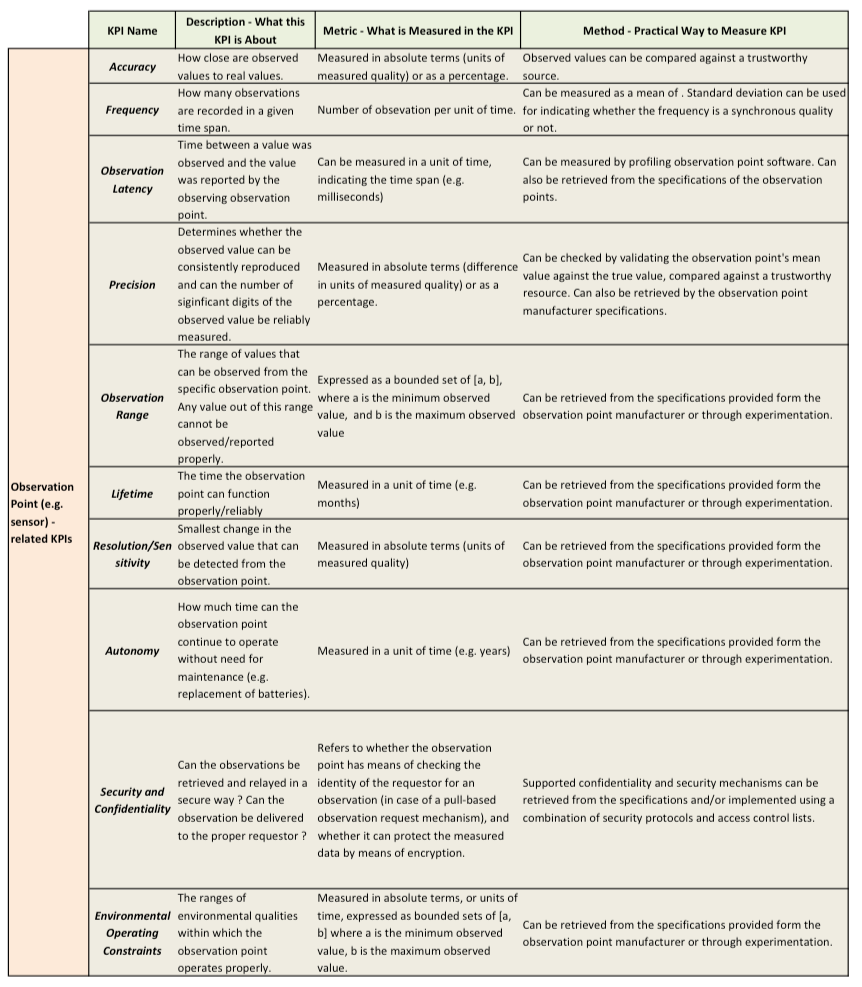
2.2 Observation Point KPIs
As Observation Point, we define an entity monitoring its environment and measuring one or more values. An Observation Point entity can be thought of as a sensor, or groups of sensors that measure qualities (e.g. temperature, humidity, amount of traffic, etc.) and send the observed data to a Processing Entity (e.g. IoT middleware software) using a Network Connection. The figure below shows the KPIs for the Observation Points. Note that in many cases the unit of measurement in the metric column is contextual to the scenario
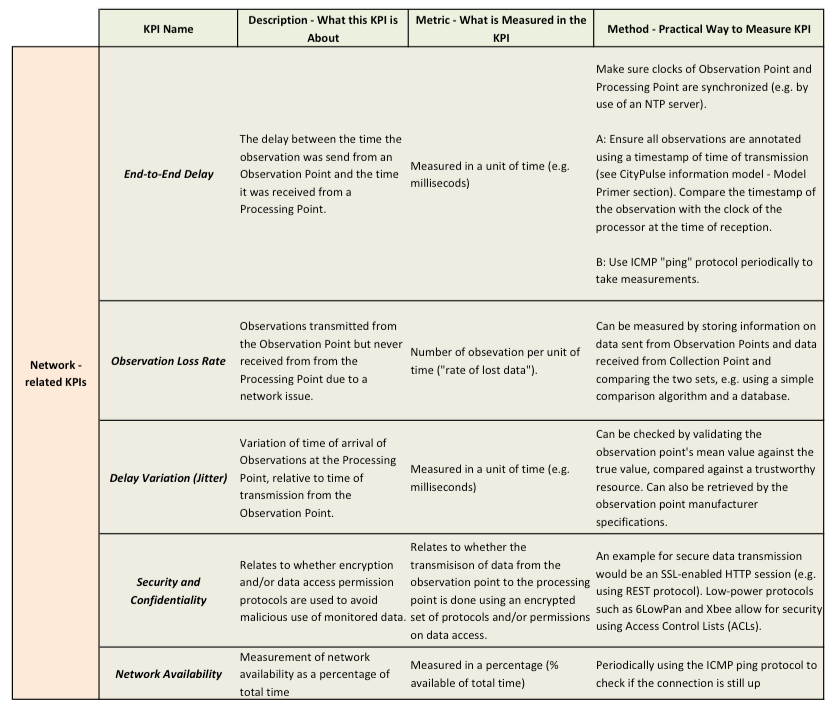
2.3 Network Connection KPIs
The Network Connection KPIs measure the quality properties of the communication medium through which observed data are transferred from the Observation Points to the Data Processing Point. The figure below shows the KPIs for the network connection. Note that these KPIs can also be used to measure network performance internally to the SCF between components (see figure 3).
2.4 Data Processing (Processing Point) Related KPIs
As illustrated in figure 3, we consider a SCF as a collection of components which interoperate and perform individual functions (e.g. data aggregation, federation/transformation, reasoning, etc.). Based on their function, some of these components may interact with external entities, e.g. other systems or users. It is possible that the output of one component may be required as part of an input to another.
As Processing Point, we define an entity that is part of the SCF and performs some processing on incoming data. This entity may be a combination of hardware and software resources, and can consist of one component, several components, or even the complete system, depending on the desired level of abstraction. For example, it may be desired to measure the performance of the data collection and storage components of the SCF together, or individually.
We define two categories of KPIs for a Processing Point, namely "Generic Processing Performance" and "Internal Processing Performance".
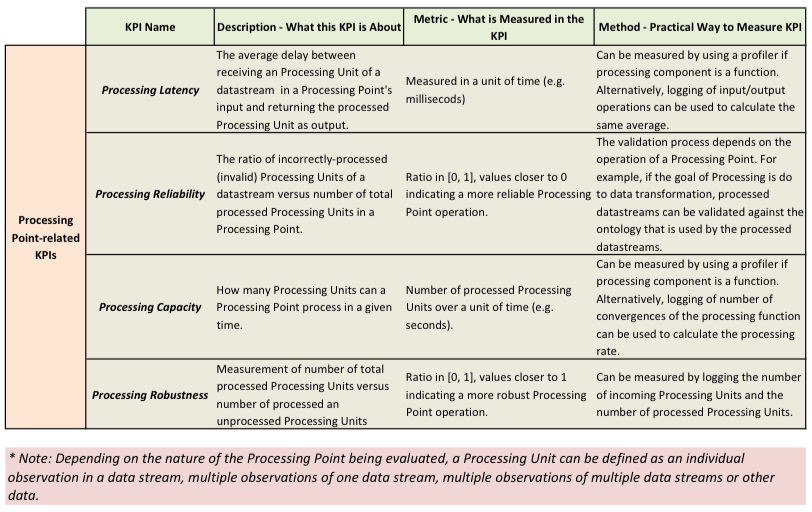
2.4.1 Generic Processing Performance KPIs
These KPIs are generic and consider the Processing Point to be a "black box", i.e. they only measure aspects of performance in terms of quantitative parameters for data input, and processed data output. They cannot evaluate the specific implementation of a Processing Point, and may be more suitable when the Processing Point implementation details are not known or are too complex to measure.
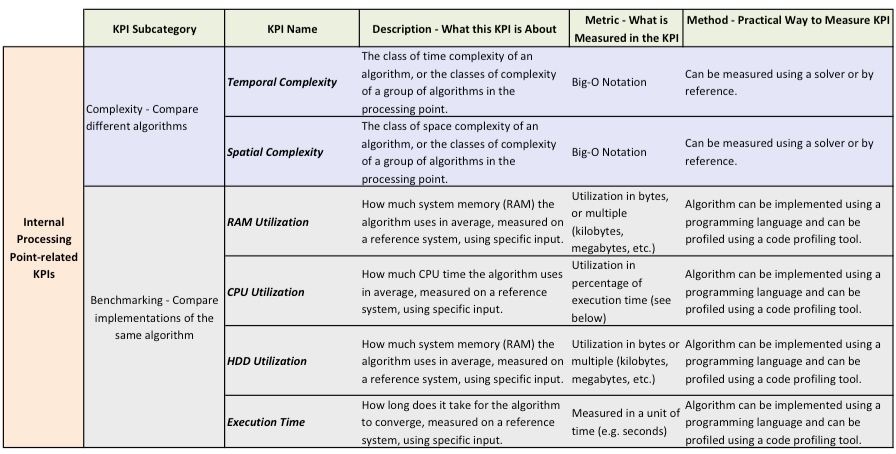
2.4.2 Internal Processing Performance KPIs
These KPIs measure aspects of performance of data processing algorithms inside a Processing Point, and can be used to compare performance of different implementations of a Processing Point with the same function but different data processing algorithms.
On a theoretical level, algorithms can be compared based on their spatio-temporal complexity. In case of well-known algorithms (e.g. graph search algorithms such as backtracking, beam search, or sorting algorithms such as quick sort and bubble sort), complexity is known in advance, whereas in other cases, complexity has to be found e.g. by reduction using a solver. The classification of an algorithm will indicate whether how suitable in terms of execution time and resources an algorithm is for the task it was chosen to perform.
On a practical level, the algorithm's performance can be quantified in computational resources and execution time using a reference system. Such measurements can be good for benchmarking different implementations of an algorithm (e.g. in different programming languages), or different algorithms that produce the same output given the same input. This will help to choose one algorithm implementation over another, even if the algorithms compared are the same or have the same complexity class (see figure 7).
3. Mapping High-Level Smart City Scenario Requirements to measurable SCF KPIs
This section describes how high-level smart city scenario requirements can be mapped to measurable SCF KPIs (see figure 8). High-level requirements at a Smart City scenario-level affect some of the quantifiable KPIs. The actual values of each of the KPIs (e.g. a desired value range, a higher or lower threshold of operations etc.), are scenario-specific and to be determined from a requirement engineer.
For example, consider a fire prevention scenario where which monitors variations in temperatures of buildings, in order to detect a potential dangerous situation as early as possible. In this case, the live-stream and reliability requirements (R3.3 and R3.5 in figure 2) may pose more strict constraints in the KPIs (e.g. much lower end-to-end delay and data loss), than for example, a scenario which monitors average rainfall in a city.
The mapping can be interpreted in two different ways:
- As design constraints to system architects for creating a new SCF for specific Smart City scenarios or Smart City scenario categories.
- As a benchmark to measure performance of existing SCFs against specific Smart City scenarios or Smart City scenario categories.